Excerpts From My First 3Q 22 Investor Letter
“We have so much opportunity, but we’re having a terrible time getting managers who can seize those opportunities. We try people from the outside, but they fail, because our culture is so different.”
Mr. Hayami nodded. “See those bamboo trees up there?” he asked.
“Yes.”
“Next year… when you come… they will be one foot higher.”
I stared. I understood.
--Phil Knight, Shoe Dog

Above are the cumulative net return (gross return net of all expenses, fees, and carry) of our fund vs. S&P 500 since inception date (April 21st, 2022). Historical returns do not guarantee future results. Although we were able to substantially outpace S&P 500 over the last six months, we do not expect such vast outperformance to be sustainable. On the right you can see some of our largest longs and shorts. Given limited space, in this letter, instead of discussing individual securities and our current view of the market, we believe it is more critical to share in detail our investment philosophy and our approach of (hopefully) generating sustainable excess returns over a long period of time. You can expect a more in-depth and extensive discussion of our view of the market and theses behind our key holdings in our annual report.
The Tumultuous Road of Long-Term Investing
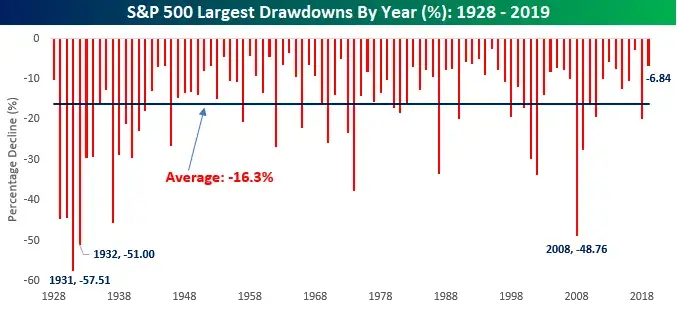
Figure 1: Largest historical drawdowns for S&P 500. (Source: BESPOKE)
In the 90 years from 1928 to 2019, the S&P 500, our benchmark, has experienced 58 drawdowns of more than 10%. In other words, in every less than 2 years, we experience a drawdown of more than 10%. To make matters worse, there has been 10 drawdowns of more than 30%! It might not mean much to you if you are not an investor, but trust me, to watch your account’s value decline by that much is simply excruciating. 2022 has been a painful year for most investors, and by the end of the third quarter (Sept 30th), the index has declined 24%, and trillions of dollars of wealth has evaporated as we sail into a rate-hike tempest.
So, why do we invest?
Well, what Mr. Hayami describes in one of your portfolio manager’s favorite books, applies to investing as well. Next year, when you look at our account, the companies we own will more likely than not have grown “one foot higher”.

Figure 2: Historical performance for stocks, bonds, bills, gold, and US dollar over the last two centuries. (Source: Stocks for the Long Run, Jeremy Siegel, 2014, Fifth Edition)
In the 210 years from 1802 to 2012, stocks have on average returned 6.6% per year. Although unimpressive at first sight, when the eighth wonder of the world, namely compounding, kicks in, nothing short of a miracle has been accomplished – one dollar invested in stocks will have become $704,997. You can see ups and downs in the chart for stock price time series, but in the face of time, any temporary setback is ironed out into a blip in the history of humanity – however, generations of speculators have been killed in those downturns. We are going through such a carnage, right now.
The path to the miracle of compounding has been tortuous, if not tumultuous. We invite you to be part of the capital compounding miracle.
The Battle That Never Ends
As active asset managers, what can Atlas add to your portfolio? Why should you entrust your capital with us, rather than simply purchasing a low-cost index fund which tracks S&P500? What is our value-added, and what is our competitive edge?

Table 1: Percentage of global equity managers who underperform the index. (Source: Standard & Poor’s, Year End 2019 SPIVA Scorecard)
As a matter of fact, based on a S&P analysis, 90% of active fund managers underperform the index over a 15 years period. In other words, the market is terribly efficient, and if you throw darts randomly at asset managers, you beat the market only once every ten throws. What confidence do we have to say that we can, on a fee-adjusted basis, outperform the market over the long term?
Our rationale is two-folded, one empirical, and one theoretical.
The empirical evidence is that your portfolio manager, over the course of the last 8 years, has managed multiple accounts. Not one of them has, on a fee-adjusted basis, underperformed their respective benchmark (investment record available upon request). Given we are operating with small sums of money, we can find more attractive investment opportunities in the equity universe. Along with a wider availability of tools such as being able to short for hedging or arbitrage using options, we are reasonably confident that as long as we operate nimble and be diligent while exercising prudence in terms of risk-control, over a lengthy period of time, we will beat the market.
The theoretical one derives its root from empirical observation, and requires an explanation of the underlying mechanism.
Given our small size, limited resources, and scarce human capital, we are at a disadvantage to compete with our rivals statically, namely larger institutions with better intelligence, human resources, and connections. Evolutionarily, we opt for a slightly different strategy – to compete dynamically.

Figure 3: General Yu Su inspecting the frontline. (Source: Wikipedia)
Few has done it better than Yu Su (粟裕), the general who fought so artistically and elegantly that he basically laid the foundation for CCP’s victory. Given inferior equipment and weaponry, he resorted to flexible movements and dynamic strategies, and seek out winning opportunities in the interim. Such has been your portfolio manager’s strategy over the past. Although we are not able to outsmart the market constantly, we are able to occasionally identify clearly mispriced assets, and pounce on such opportunities. What do we do when we cannot identify such opportunities? We simply widely diversify our assets into companies with durable moats and earning lucrative returns on its asset base to protect ourselves against the risk of the market moving up. In our view, such a process conforms to the art of Tai Chi as well. Whether Chen-style or Yang-style, the movement of Taichi is mostly fluid and soft, with several movements being particularly curt and powerful, serving the two “dots” at the middle of the circle.

The “generally diversified and occasionally concentrated” approach also conforms to “parallel scanning”, an ingenious strategy adopted by ants such that most of ants focus on the daily routine while a selected few engage in excursions to find food sources – these selected few are responsible for identifying home-runs for the masses.
Nevertheless, clever readers might ask, given the countless intelligent participants in the market, how can you ascertain the existence of inefficiencies, and how can you be confident that the dynamic strategy delineated above can be applied from time to time?
Like most investors, we are humble enough to acknowledge that we frequently make mistakes. As a matter of fact, even during the last six months, your portfolio manager was way too early to dip his toes into the financial services and media sectors which he thought were oversold, and lost you a fortune due to his misjudgment. However, there are two commonly telltale signs that render such a profitable practice possible on an episodic basis.
1) Liquidity crisis. Seth Klarman commented that “liquidity is never there when you most need it”. From time to time, the market dries up. If one is to profit from her opponents’ mistakes, then one of the greatest mistakes her opponents will make is to be forced to sell due to bad timing, over-leveraging, margin calls, among a variety of misfortunate reasons. Forced selling creates unbelievable opportunities, and is a place where substantial fortune can be made if patience is exercised and bold actions are taken at critical joints.
2) Capital cycles. The moon wanes and waxes, and just like the moon, capital cycles wanes and waxes. Sentiment can shift within a very short span of time.

Figure 4: Graphic illustration of output cyclicality. (Source: Fundsnetservices.com)
It is part of human nature to chase what is “hot” and be scornful of what languishes on the ground. When capital flows into a certain industry, it gets overheated, competitors swarm in, and profit margin deteriorates; when capital flies away from a certain industry in drives, consolidation happens, price wars abate, and profitability soars. Human civilization spirals in a cyclical way upward. While we generally ride the trend through maintaining a substantial long position, we enhance our returns and generate excess alpha through directing our capital to cheaply valued assets discarded by the Street which have the potential of mean-reverting back to profitable cash machines. Your portfolio manager has successfully navigated historical capital cycles during the mini-industrial recession of early 2016 and the commodities downturn of 2019-2020. When the Fed tightens and financial conditions get grim, we believe such opportunities will naturally present themselves, and we try to survey as wide a landscape to take advantage of such opportunities when they occur.
Our Criteria for Selecting Businesses
After narrating our top-down view, it is important to articulate our favored businesses.
In short, we like winners (which we long at appropriate prices), and we hate dogs (which we short when they are substantially overvalued). Think about your friends – if they are financial assets, and you can select five of them to invest such that you reap a certain proportion of their future income, who will you select? After you select them, try to think of their common traits. Same for selecting businesses. We like to invest in companies with strong network effects, with powerful brands and high switching costs among its customer/user-base, who can cultivate habits/stickiness among its customers/users, and who has a proprietary technology or unique access to resources and/or enjoy economies of scale such that they possess cost advantages. Such competitive traits are reflected in the companies’ ability of consistently earning excess returns, to successfully defend their market share when facing fierce competition, and to generate strong cashflow while maintaining a healthy balance sheet to reward shareholders. Like alluded to before, your portfolio manager will devote more time and space to discuss our key holdings and our macro view by the end of the year, while our third quarterly letter will primarily focus on our philosophy, approach, and appropriate investor expectations. We are and probably will be fully invested for most of the time, and we almost invest exclusively in US equities, as we believe the US hosts some of the best companies under one of the best institutional and capitalist-friendly setting that we see on a global basis.
What to Expect from Us
If your goal is to double your asset base every two years, then you have definitely found the wrong asset manager.
Before you entrust capital with us, there are two graphs that we want to share with you.

Figure 5: Performance comparison between a certain fund A and S&P 500. (Source: Company A’s Shareholder Letter)
This is one of my all-time favorite charts. As one can easily see, in 5 long years, A has not been able to outperform S&P500. In addition, for two long years (year 3 and year 4), A’s investors will endure a 50% peak to trough drawdown. The annualized return in those five years has been worse than investing in the treasury yield, or even a savings account.
That A is Berkshire Hathaway, from 1972 to 1975. In our view, 99% of investors would have bailed before the painful end of the 5th year, thereby relinquishing the chance of participating in the greatest capital appreciation program of human history.

Figure 6: Sequoia’s investment performance vs. S&P 500 from 1969 to 1974. (Source: Sequoia Fund)
When Sequoia Fund was first launched, most of Bill Ruane’s friends, including Buffett, thought they could have picked a better time. Their worries came true, and Sequoia Fund underperformed the market until 1975. Again, we figure most investors will bail, and leave out one of the best performing funds in the mutual fund history.
We believe that through diligence and intelligent adoption of a dynamic and flexible investment program, we will be able to generate a post-fee annualized return of 12% over a reasonably long period of time. To put things into perspective, we will use illustrate the difference between our annualized return and market return compounded over various periods of time.
Although the advantage of compounding at 12% rate was not conspicuous with a 10-year horizon, it becomes transparently superior as time goes on. If one compounds at 12% for 50 years, she will make 289 times of her original investment, versus “only” 24.43 times if she compounds at 6.6% (which, by the way, is not bad at all either…).
Our vast outperformance against the market is NOT sustainable in the long term, and we do not want to give our investors the false impression that your portfolio manager will be able to generate an alpha (excess return) of more than 20% in each and every half year period. Berkshire Hathaway underperforms the market once every three years – expect our underperformance at a higher frequency. We will much prefer to under-promise and then over-deliver, versus the other way around. Our goal is “modest” – we hope that in the long run we will generate an after-fee annualized excess return of 300-400 bps (or 3-4%) inclusive of dividends. If we can achieve that, we believe that we will not only outperform 95% of our peers, but will also be able to do wonder for your capital. We thank you for considering us as your partner, and embark on this exciting journey together.
Sincerely,
Jingshu Zhang
Sept 30th, 2022
Comments